Astronomy | GXR · GR · RX100 M1 · RX100 M4 · RX10 M3/4 · TZ202 · X Vario · M240 · General | Photos | Conf. Places | Calendars | Art
General: Calculating the Optimum Aperture for Different Sensor Sizes (Diffraction Limit)
Introduction: Aberrations versus Diffraction when Stopping Down | Calculating Diffraction Limited Spot Size and Relating it to the Circle of Confusion | Calculations | Circle of Confusion, Print Size, and Pixel Size... | Sample Images for Checking the Effect of Diffraction | Conclusions | Appendix | References
On this page, I try to summarize an article by Bob Atkins "Optimum Aperture - Format size and diffraction" in which he investigates, which aperture of a lens will deliver the sharpest results. While he focuses on different print formats, which also stand for different film/sensor formats, I will simplify the discussion and just ask the question for different sensor sizes, represented by different circles of confusion (CoC). Please note that the results are actually independent of technology and only determined by the circle of confusion.
Introduction: Aberrations versus Diffraction when Stopping Down
Aberrations and Stopping Down Lenses
According to Atkins, the optimum aperture of a lens, that is, the aperture at which it is sharpest, varies from lens to lens. As a general rule it is between one and three stops down from the maximum aperture for the center of the field. He explains that no lens is perfect, they all have aberrations which reduce their performance. Classically there are five so-called "Seidel" aberrations:
- Spherical aberration
- Coma
- Astigmatism
- Field curvature
- Distortion
Atkins notes that "all lenses have these aberrations and they are worse in fast lenses. Stopping down a lens greatly reduces spherical aberration and to a lesser extent reduced the effects of coma, astigmatism and field curvature on image sharpness. Distortion is unaffected by aperture. A 6th aberration, chromatic aberration, is to a first approximation unaffected by aperture, too."
Diffraction as a Limit to Stopping Down Lenses
If aberrations are reduced as you stop down, one might assume that the image would get sharper, the smaller the aperture gets. But this does not happen, because "diffraction" sets in and reduces image sharpness: The more you stop down, the larger diffraction effects get. Diffraction can be described as "the spreading out of a light beam when it's 'squeezed' though a small aperture." The smaller the aperture, the more the light spreads out.
Note: For more information on diffraction, the airy disk as a measure for it (which can be compared with the circle of confusion), etc. see the tutorial Lens Diffraction & Photography on the "Cambridge in Color" Website by Sean McHugh; there is also a second page covering more advanced topics.
Atkins then presents the notion of a "best" aperture, "which is a balance between reducing the optical aberrations and increasing the effects of diffraction. Typically this happens when a lens is stopped down a few stops from wide open. That's typically enough to significantly reduce spherical aberration, but not enough to make diffraction a problem. Most good lenses will peak in sharpness in the center of the image field somewhere between f/4 and f/8."
Stopping down to smaller apertures than f/4 - f/8 may nevertheless still improve image quality in the image corners, because "the effects of coma and astigmatism are reduced slower with decreasing aperture." Stopping down past f/8 may therefore further reduce their effects at the edges and corners of the image. Atkins asks, "But how far down can you go before the image really starts to suffer from an overall loss of sharpness?" - and provides "his" answer.
Calculating Diffraction Limited Spot Size and Relating it to the Circle of Confusion
In his article, Atkins introduces the concept of the circle of confusion, which is mentioned on this site in several places (definition). His brief definition is as follows:
- The circle of confusion value is the maximum diameter of the image of a point source which will allow a reasonably sharp 8 x 10 print to be made from the image. It basically states that if you want a sharp image, it has to be made up of well focused (i.e. small) points.
Atkins calculates "the size of the image of a point formed by a perfect
lens (i.e. one with no other aberrations)" and collects this in a table
for various f-numbers (see below). He writes, "The
image of a point is known as the diffraction limited spot size" (given
in microns - 1 micron is 1/1000 mm)." The "image of a point" may
well be the same as the airy disk* (definition),
the diameter of which is a measure for the amount of diffraction.
The "Airy disk" received its name from its discoverer, Mr. Airy.
Therefore is should read "Airy disk" but is usually written "airy
disk".
I changed Atkins' table somewhat: I added some columns to his table (and deleted the rows with larger f-numbers...), which relate the circle of confusion and the sensor format to spot size (or airy disk size), included my own calculations, and arrived at the following result:
| Lens Aperture | Diffraction Limited Spot Size (microns) |
My Own Calculations* |
Nearest Circle of Confusion (mm) |
Sensor Format | Cameras with Respective Sensor Format |
| f/4 | 5.4 | 5.33 | 0.006 | 1/2.3", 1/1.7" | Ricoh CX4 (and myriads of other small sensor cameras) |
| f/5.6 | 7.5 | 7.53 | |||
| f/8 | 10.7 | 10.65 | 0.011 | 1" | Sony RX100 M1ff |
| f/11 | 14.7 | 15.07 | 0.015 | MFT, 4/3" | (Micro) Four-Thirds cameras |
| f/16 | 21.5 | 21.31 | 0.02 | APS-C | Leica X Vario, Ricoh GR |
| f/22 | 29.5 | 30.14 | 0.03 | Full-format | Leica M (Typ 240) |
| f/32 | 43 | 42.62 | 0.05 | Medium format | Pentax 645 (0.032...0.055 depending on criterion) |
*) My own calculations are based on a formula for the airy disk size from a Webpage by Oldham Optical UK and use exact f-numbers. They only serve as a check as to which formula Atkin's calculations might be based on. There is also a calculator for the airy disk diameter on the Cambridge in Colour Website, which deliveres the same values for the airy disk as Atkin's calculations (standard CoC conditions). Both authors do not seem to use "exact" f-numbers.
Note that is was initially my own idea to relate diffraction measures (size of airy disk/diffraction limited spot size) to the circle of confusion. But this is just what the diffraction limit calculator discussed below does (Atkins does it indirectly via print sizes)...
My (and my wife's and other) cameras have the following circles of confusion:
- Leica M (Typ 240) (full format): 0.03 mm
- Leica X Vario (APS-C, DX format): 0.02 mm (0.019 mm for a focal length of 18 mm)
- Ricoh GR (APS-C, DX format): 0.02 mm
- (Micro) Four-Thirds format: 0.015 mm
- Sony RX100 M1 (1"): 0.011 mm
- Ricoh CX4 (1/2.3"): 0.00578 mm
So, the generalized results (derived from formulae irrespective of the particular cameras, lenses, and sensors) for the "optimum apertures" are:
- f/4: small sensor cameras (1/2.3", 1/1.7")
- f/8: 1" sensor cameras
- f/11: MFT and 4/3" cameras
- f/16: APS-C cameras
- f/22: full-format cameras
Please note that this are limits that diffraction sets to image quality; it sets in at much smaller f-numbers, but this is a "gradual" process (for details, see Digital Camera Difraction, Part 2 on the "Cambridge in Colour" Website by Sean McHugh).
Calculations
I do not know how Atkins calculated the diffraction limited spot size. However, a Russian Sony RX100 M1 user pointed me to a formula for the size of the airy disk published by Oldham Optical UK (for details see below), which leads to more or less identical results. Thus, Atkins must have used a variant of this formula as well.
Diffraction Limit Calculator
The above-mentioned Sony user pointed me also to the Cambridge in Colour Website, which offers two pages about diffraction (see References), including several versions of a calculator for the diffraction limit (with a decision criterion comparing the CoC with the airy disk diameter). The "simple" and "advanced" versions of the calculator delivers the same results as Atkins' and my own calculations and thus, seems to be based on the same formula. The advanced version delivers some further options for calculating the CoC. There is another version of the calculator on a second page, which delivers somewhat more strict results, because it calculates when diffractions "sets in", which is different from "limiting". In the following, I deal only with the calculators (simple and advanced) that calculate the diffraction limit.
Simple Version
The "simple" version of the calculator for the diffraction limit just calculates the CoC ( depending on the camera and the sensor size) and the airy disk diameter (for a given focal length), compares the two, and delivers a decision as to whether the diffraction limit has been reached.
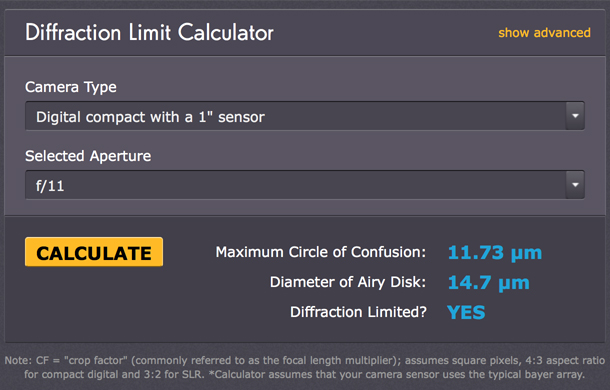
This calculator was a bit awkward to use for me at first. Therefore, I give a few hints on its usage. The camera type selector influences only the maximum circle of confusion, the aperture selector only the diameter of the airy disk. If you change your settings, press the "Calculate" button to update the result. The answer to the "Diffraction limited?" question seems to be based on a direct comparison of CoC and airy disk diameter.
Since I know now, how the calculator arrives at its results, I prefer to use an Excel spreadsheet and calculate a table for different f-numbers and sensor sizes. This relieves me from having to remember any values...
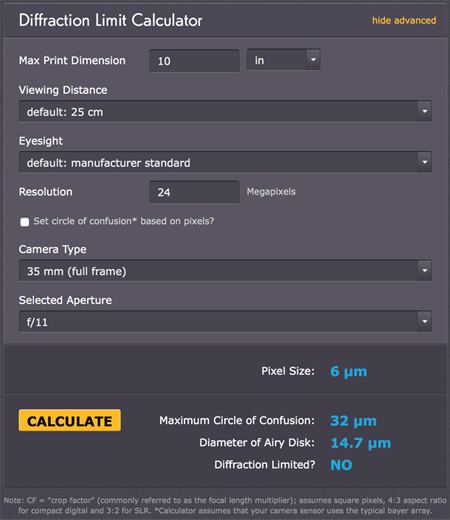
Advanced Version
The "advanced" version of the calculator allows you to take the viewing characzteristics (viewing distance, print size, and eyesight) into account. I do not cover this here (I just set the defaults), but will come back to this later. Then there is one more feature: You can also specify the sensor resolution (pixel count) and calculate the CoC on the basis of the pixel size (see figures below).
 |
 |
Thus:
- If you let the checkbox "Set circle of confusion based on pixels?" unchecked, you will get a result for a CoC based on the viewing conditions (the default values deliver the values for the "simple" version of the calculator), which also takes care of the crop factor for sensor sizes other than the full-frame format.
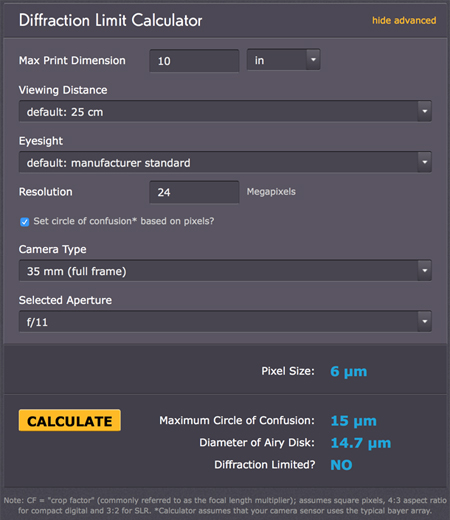
- If you check the checkbox, you get, however, a CoC based on the pixel size, which seems to be a factor of 2.5 larger* than the pixel size.
*) I do not know how the author arrived at a factor of 2.5. I looks as if this factor is based on the precondition that a Bayer filter and an AA filter is used. He lists different numbers on his two "diffraction" pages, but not 2.5... Elsewhere, I found a factor of 2 for this condition (and a factor of square root of 2 for black and white).
If you use this feature, you get a different answer for the "Diffraction limited?" question. Now, the airy disk is often larger than the CoC, even for smaller f-numbers. The Website explains the purpose of this setting:
- The "set circle of confusion based on pixels" checkbox indicates when diffraction is likely to become visible on a computer at 100% scale.
Thus, this setting is dedicated for people, like me, who occasionally like to view their photos on the computer screen in 100% size. I think, the statement above should be taken "with a grain of salt", but nevertheles the results can be a good "rule of thumb" of what to expect when we view photos at 100% on our computer screen. I still have to figure out whether this feature is indeed useful in practice...
Circle of Confusion, Print Size, and Pixel Size...
Above, I mentioned that the advanced calculator on the "Cambridge in Colour" Website can also consider the viewing characteristics and adapt the circle of confusion accordingly. This feature may be useful if you are interested in the effect of your viewing conditions on the "sharpness" of your photos.
In addition, the calculator's "sensor" feature provides an estimate for viewing photos on a computer screen at 100%. Below are the results that I calculated using the "advanced" calculator:
|
|
CoC Criterion
Based on... |
||||||||||||||
Print Size (Distance
25 cm) |
Sensor* |
||||||||||||||
| Sensor Format | Aperture | Airy Disk (µm) |
Inch |
cm |
Pixel Count |
||||||||||
4 |
6 |
8 |
10** |
20 |
10 |
15 |
30 |
45 |
50 |
60 |
20 MP | 24 MP | |||
| 1" | f/11 | 14.7 |
29.33
|
19.55
|
14.66 |
11.73
|
5.87
|
29.79
|
19.86
|
9.93
|
6.62 |
5.96 |
4.97
|
6.14 (2.5)* |
5.61 (2.20) |
| f/8 | 10.7 |
||||||||||||||
| f/5.6 | 7.5 |
||||||||||||||
| f/4 | 5.3 |
||||||||||||||
| Full-frame | f/22 | 29.3 |
80.00
|
53.33
|
40.00 |
32.00
|
16.00
|
81.28
|
54.19
|
27.09
|
18.06 |
16.26 |
13.55
|
16.43 (6.6) |
15.00 (6)** |
| f/16 | 21.3 |
||||||||||||||
| f/11 | 14.7 |
||||||||||||||
| f/8 | 10.7 |
||||||||||||||
| f/5.6 | 7.5 |
||||||||||||||
| f/4 | 5.3 |
||||||||||||||
CoC (µm), Pixel Size (µm) |
|||||||||||||||
*) Corresponds to viewing the photos on a computer screen at 100%; **) default
print size for "standard" CoC
*) Sony RX100 M1; **)
Leica M (Typ 240)
gray: diffraction limited
All in all, the table delivers a mixture of results, some related to diffraction, others not... Note that the CoC values for the two sensor formats differ in just the crop factor (2.7). The airy disk depends only on the f-number.
These are my conclusions from the table above:
RX100 M1
- Print: The CoC limit is reached at about 10" for f/8. f/11 is "diffraction limited" at about this size (the "standard"), but not at a print size of 8" or smaller. Thus, f/11 could be used if you print at sizes of 8" and smaller.
- Screen 100%: The diffraction limit is reached between f/5.6 and
f/4.
Viewing photos on the screen at 100% corresponds roughly to a print size of 20" or 50 cm (at 25 cm viewing distance).
For the Sony RX100 M1 we can state that you can print at sizes of 8" or smaller without caring for diffraction effects, and at print sizes of 10" and smaller if you do not go beyond an f-number of f/8. Diffraction effects should become visible at 100% screen size between f/4 and f/5.6 (but diffraction sets already in at lower f-numbers).
Using an image size of 10 MP would improve numbers (based on pixel count and sensor size) by a factor of square root of 2 (1.414...), using 5 MP by a factor of 2. But I do not know, what the camera really does, when it uses these smaller image sizes...
Note: See below for sample images that you can download to check the effect of diffraction on your computer screen.
Leica M (Typ 240)
- Print: The CoC limit is reached at about 10" for f/22 and at about 20" for f/11. f/22 is nearly "diffraction limited" at about the "standard" size, but not at a print size of 10"/DIN A4 or smaller. Thus, f/22 could be used if you print at sizes of 10" and smaller.
- Screen 100%: The diffraction limit is approached at f/11.
Viewing photos on the screen at 100% corresponds roughly to a print size of 20" or 50 cm (at 25 cm viewing distance).
For the Leica M (Typ 240) we can state that you can print at sizes of about 10" or smaller without caring for diffraction effects, and at print sizes of 20" and smaller if you do not go beyond an f-number of f/11. Diffraction effects should become visible at 100% screen size at about f/11 (but diffraction sets already in at lower f-numbers).
Note: See below for sample images that you can download to check the effect of diffraction on your computer screen.
Sample Images for Checking the Effect of Diffraction
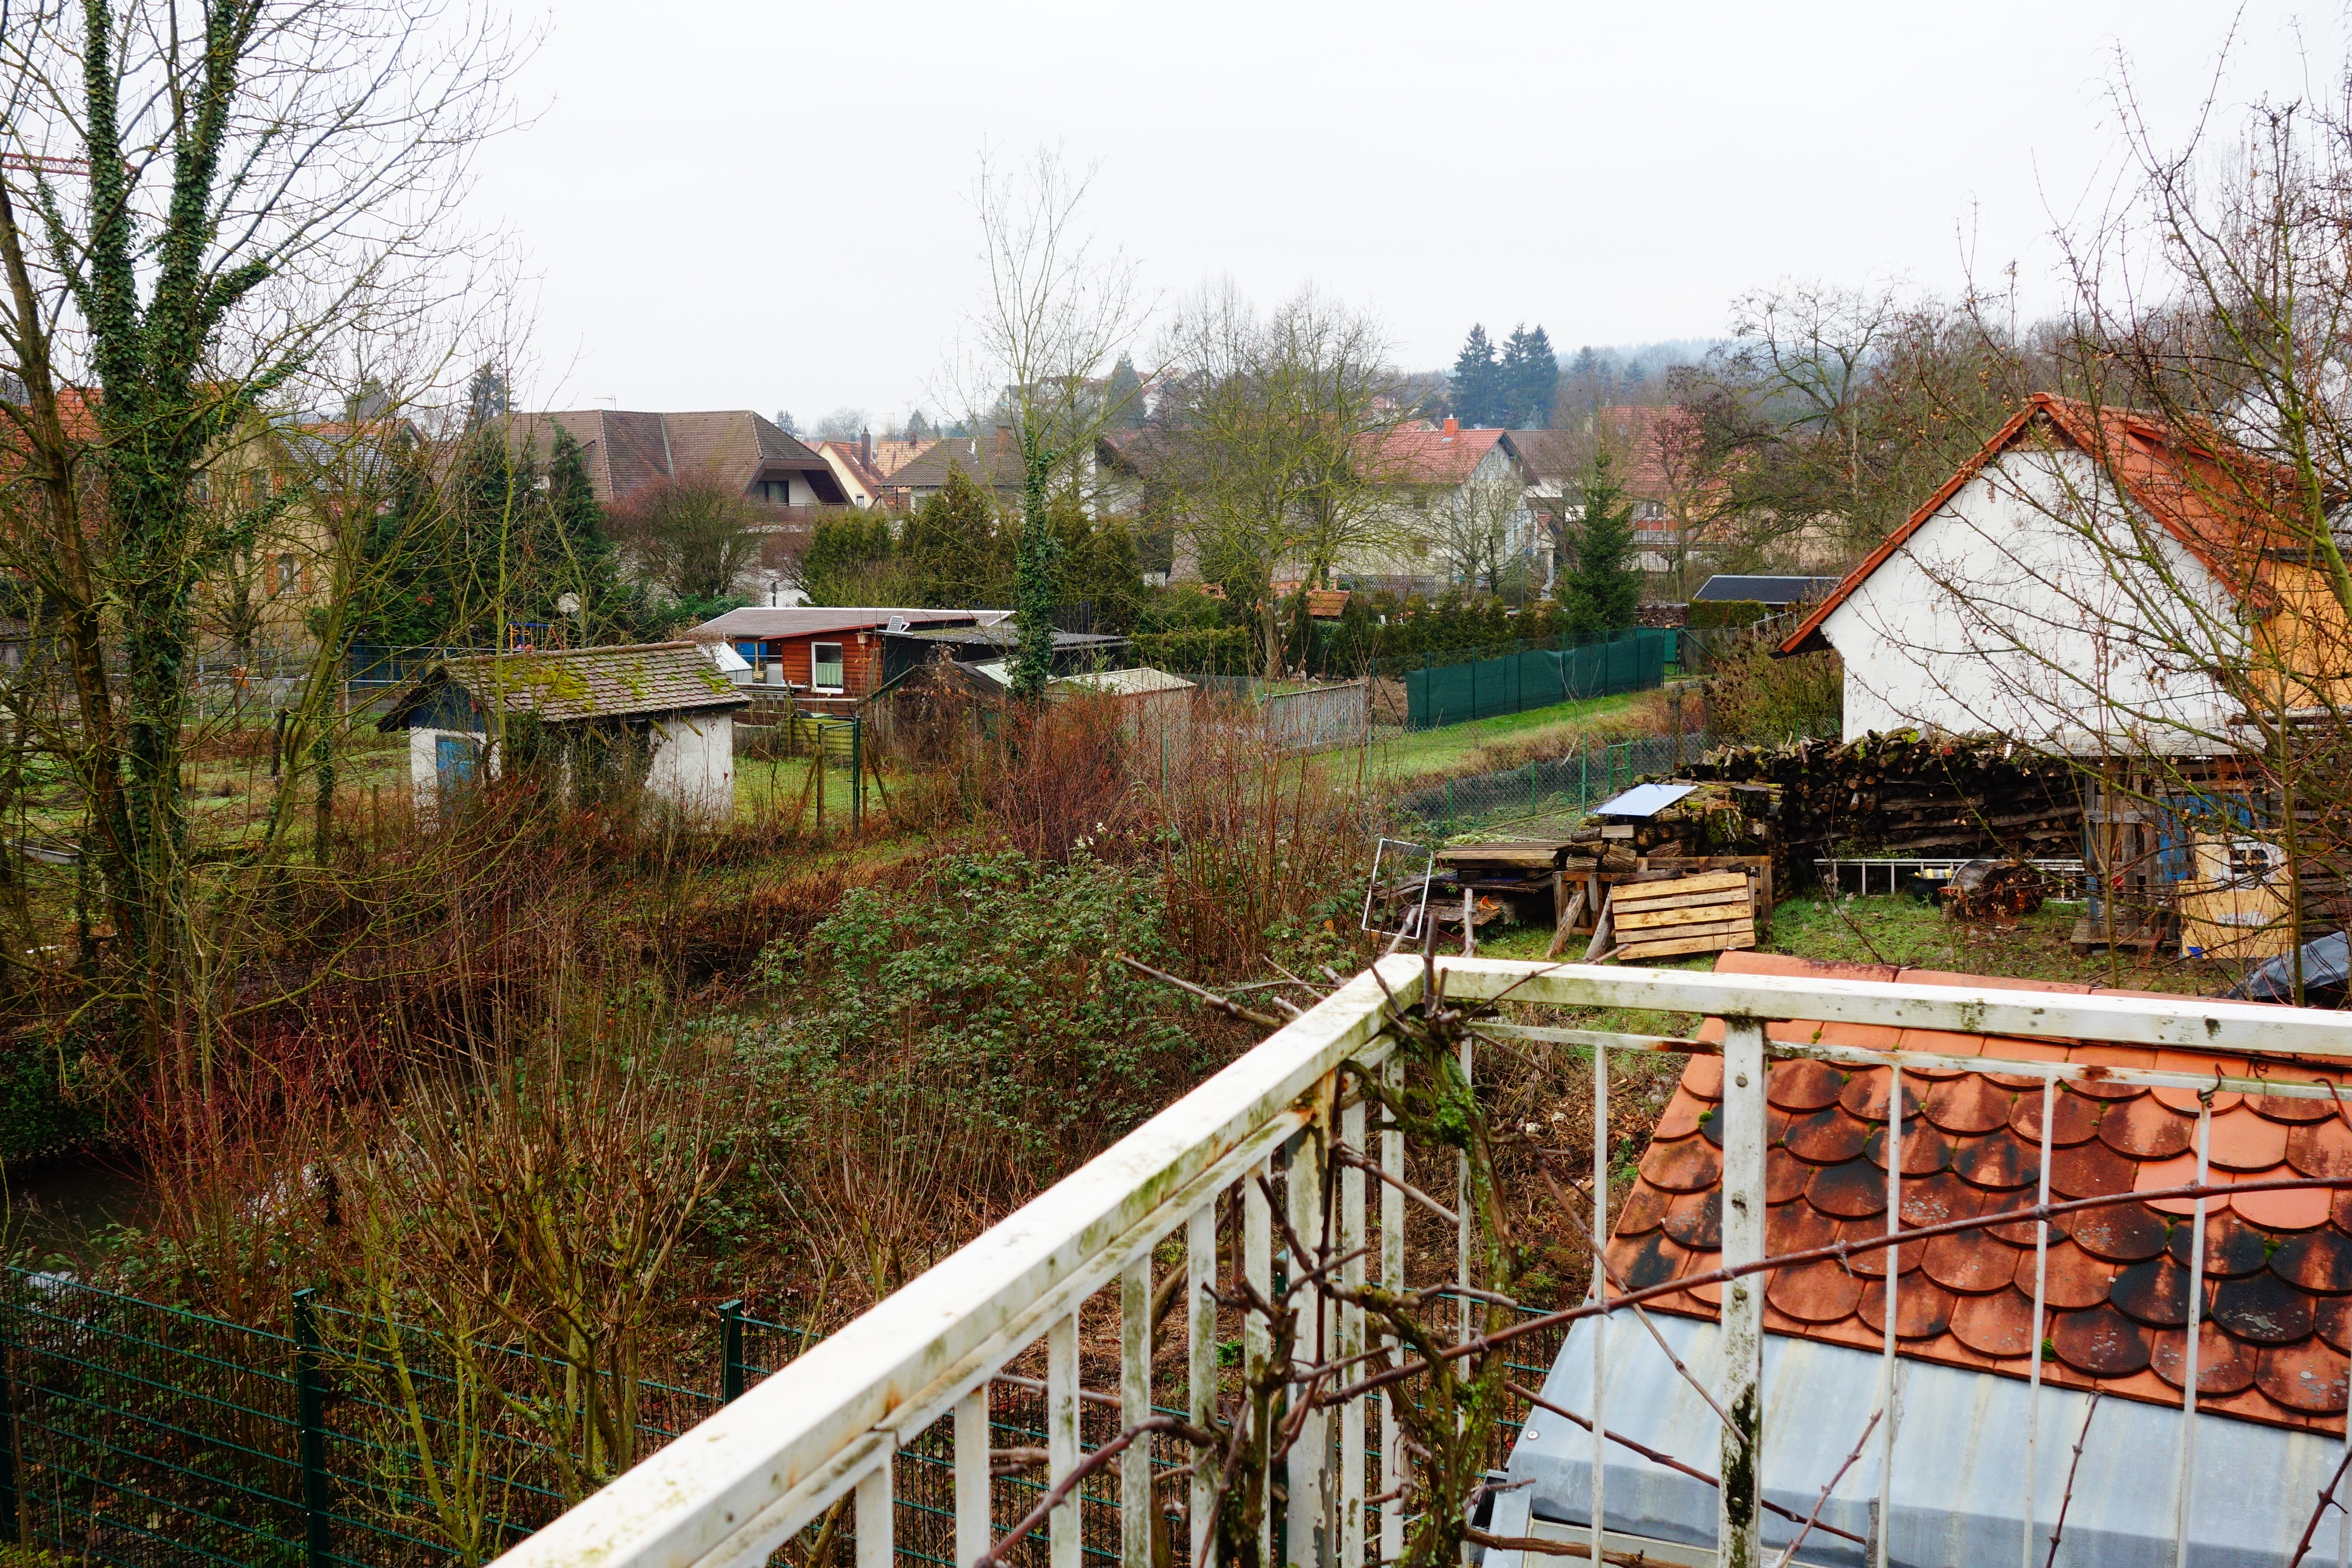
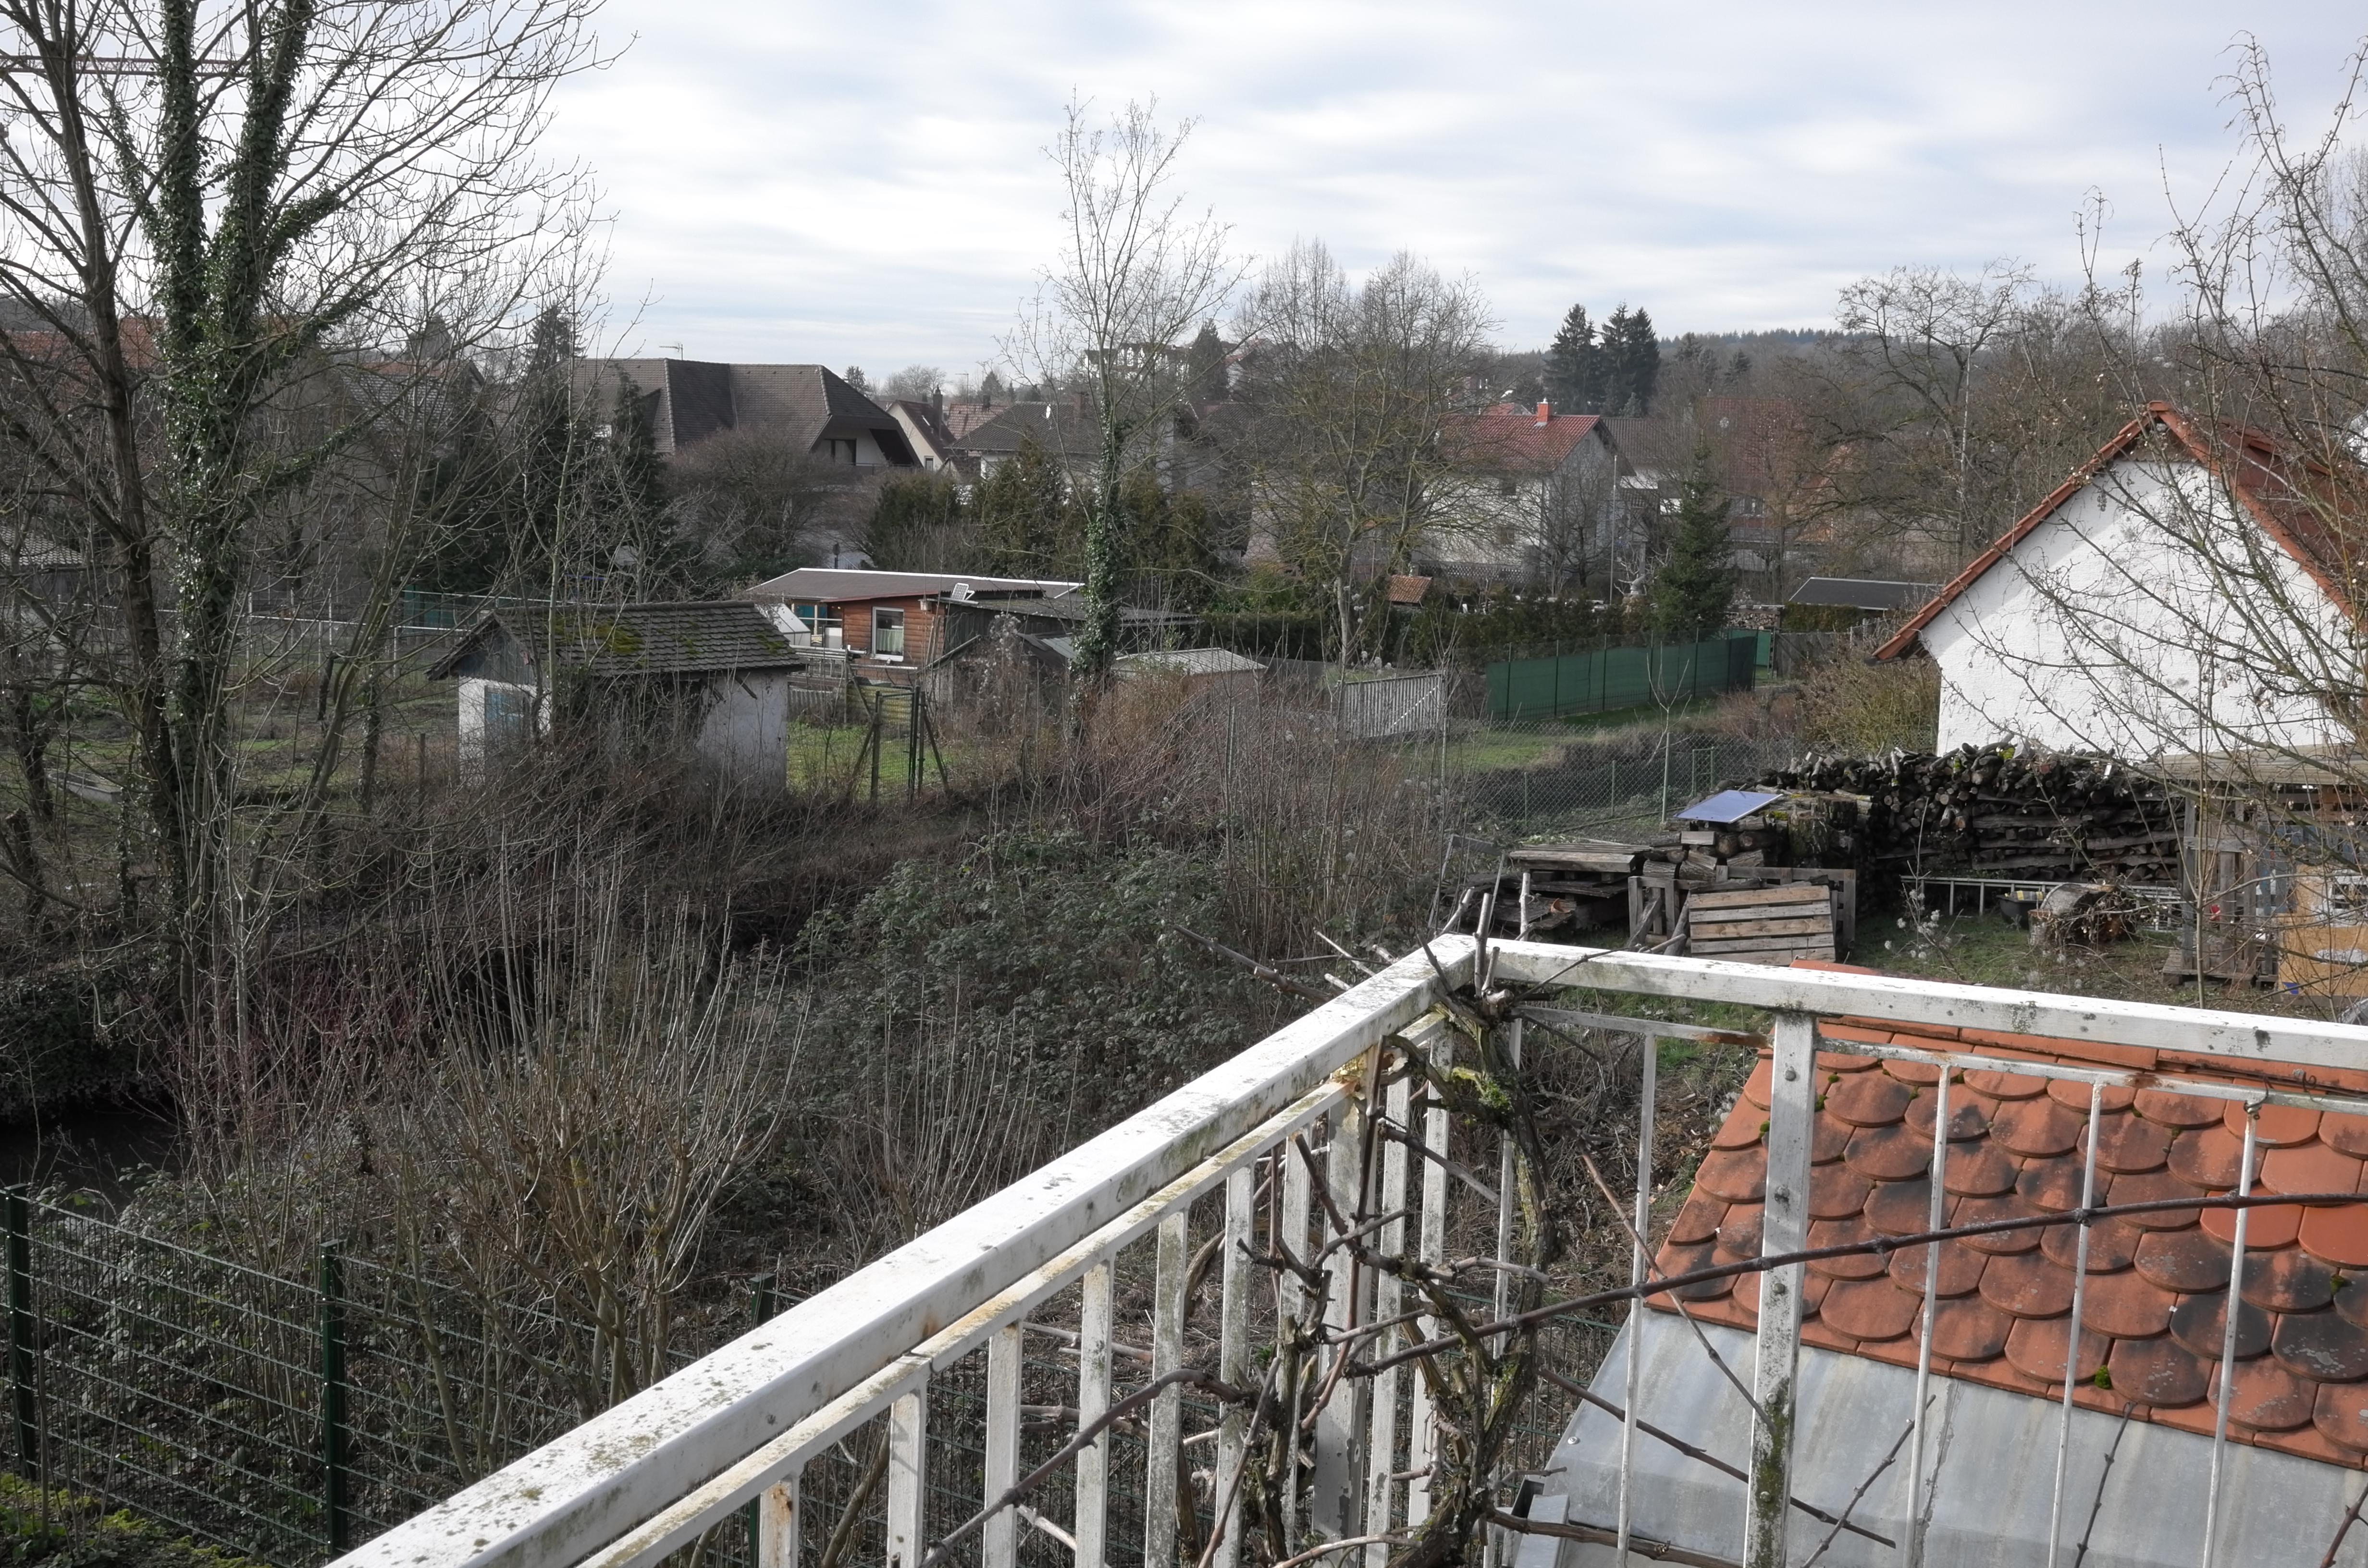
In the following, I show sections from example photos that I took at different f-numbers and with different cameras to look for diffraction effects. Of course, this is just a "quick-and-dirty" investigation. Nonetheless, diffraction effects can be found on the computer screen at least at 100% magnification. What this means in your photographing practice, is up to you...
Sony RX 100 M1 (1" Sensor)
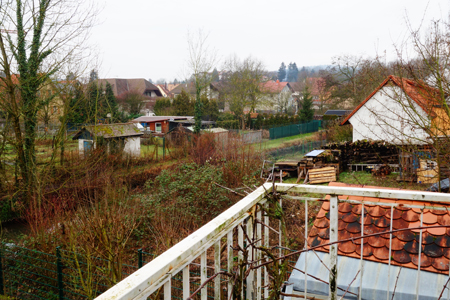 |
Using the following photos taken with the Sony RX100 M1, you can observe on a computer screen at 100% magnification how diffraction increases with f-number. About the photos: The photos were taken with a tripod at the f-numbers f/4, f/5.6, f/8 and f/11 in A mode. Distance was set to infinity using AF and then fixed by switching to MF. ISO was set to ISO 200, and a focal length of about 35 mm (equiv.) was used. The images below are 100% sections. Click the images to download or view the photos in full size. |
|
Overview sample |
||
 |
 |
|
f/4 |
f/5.6 |
|
 |
 |
|
f/8 |
f/11 (maximum f-number) |
Note: Here are some more photos that can also be used for this purpose. They were taken with focus at infinity to be compared with photos where distance was set to the hyperfocal distance: f/5.6, f/8, f/11.
Leica X Vario (APS-C)
Using the following photos taken with the Leica X Vario, you can observe on a computer screen at 100% magnification how diffraction increases with f-number.
About the photos:
The photos were taken with a tripod at the f-numbers f/4.5, f/5.6, f/8, f/11, and f/16 in A mode. Distance was set manually to infinity. ISO was set to ISO 200, and a focal length of about 35 mm (equiv.) was used. A self-timer was used for taking the photos.
The images below are 100% sections. Click the images to download or view the photos in full size.
Overview sample |
|
|
|
f/4.5 (f/4 was not possible at 35 mm) |
|
 |
 |
|
f/5.6 |
f/8 |
|
 |
 |
|
f/11 |
f/16 (maximum f-number) |


Note: Here are some more photos that can also be used for this purpose. They were taken with focus at infinity to be compared with photos where distance was set to the hyperfocal distance: f/5.6, f/8, f/11, f/16.
Leica M (Type 240) (Full-Frame Format)
 |
Using the following photos taken with the Leica M (Typ 240), you can observe on a computer screen at 100% magnification how diffraction increases with f-number. About the photos: The photos were taken with a tripod at the f-numbers f/4, f/5.6, f/8 , f/11 and f/16 in aperture priority mode. Distance was manually set to infinity (manual lens). ISO was set to ISO 200, and a lens with a focal length of 35 mm was used (Zeiss Biogon 35mm f/2.8). The images below are 100% sections. Click the images to download or view the photos in full size. |
|
Overview sample |
||
 |
 |
|
f/4 |
f/5.6 |
|
 |
 |
|
f/8 |
f/11 |
|
 |
 |
|
f/16 |
f/22 (maximum f-number) |
Note: Here are some more photos that can also be used for this purpose. They were taken with focus at infinity to be compared with photos where distance was set to the hyperfocal distance: f/5.6, f/8, f/11, f/16, f/22.
Conclusions
Overall, the calculations of the diffraction limit provide a fairly simple rule of thumb as to which aperture value is the "optimum" (or largest you should use...) for which sensor size. But, as the advanced versions of the diffraction calculator indicate, you can also have it more complex if you want to...
Appendix
Airy Disk Size (From Oldham Optical UK)
The airy disk can be calculated as follows:
- D = 2.43932 * λ * (focal ratio of telescope) (D = Diameter of Airy Disk in mm; λ = wavelength in mm, e.g. 546 nm = 0.000546 mm)
Example: If focal ratio = F/4 and a wavelength of 546 nm used, then D = 0.00533 mm); this comes close to the circle of confusion for small-sensor cameras and thus, confirms Atkin's calculations (or he used the formula...)
Another formula for the diameter of the airy disc is:
- A = 7200 * arctan (1.21966 * λ / d) (A = angular diameter of the airy disk in arc seconds, d = diameter of telescope main mirror in mm)
I assume that the formulae are also valid for lenses (telescopes do not have apertures, you just use the diameter of the primary mirror). For references, see below.
Resolving Power (From Olympus - Knowledge)
The resolving power of an objective lens is measured by its ability to differentiate two lines or points in an object. The greater the resolving power, the smaller the minimum distance between two lines or points that can still be distinguished. The larger the numerical aperture, the higher the resolving power.
Resolving Power Formula
The following formula is generally used for determining resolution (epsilon):
- epsilon = 0.61 * λ / (numerical aperture) (λ = wavelength = 0.55 µm for visible light)
The numerical aperture is a key factor to the performance of an objective lens (resolving power, focal depth, and brightness).
Examples: The resolving power epsilon is 0.333 µm for f/1, 0.042 for f/8, 0.021 for f/16, 0.015 for f/22, and 0.01 for f/32.
For references, see below.
References
- Bob Atkins: Optimum Aperture - Format size and diffraction (www.bobatkins.com/photography/technical/diffraction.html)
- Pumplin's Lecture Notes for Physics 232 (Spring 2000) : The resolving power of a lens (www.pa.msu.edu/courses/2000fall/PHY232/lectures/interference/resolve.html)
- Olympus - Knowledge: Resolving Power (www.olympus-ims.com/en/microscope/terms/resolving_power/)
- Olympus - Knowledge: Numerical Aperture (www.olympus-ims.com/en/microscope/terms/numerical_aperture/)
- The Airy Disc - An Explanation of What it is and Why You Can’t Avoid it (Oldham Optical UK): www.oldham-optical.co.uk/Airy%20Disk.htm
- Lens Diffraction & Photography (Cambridge in Colour, Sean McHugh): www.cambridgeincolour.com/tutorials/diffraction-photography.htm
- Digital Camera Diffraction, Part 2 (Cambridge in Colour, Sean McHugh): www.cambridgeincolour.com/tutorials/diffraction-photography-2.htm
- OptoWiki: www.optowiki.info/faq/how-to-convert-pixel-size-in-line-pairs-per-millimeter/?noredirect=en
OptoWiki: www.optowiki.info/faq/how-to-convert-lines-pairs-per-millimeter-to-pixel-size/?noredirect=en - Limiting resolution and MTF - Vision Doctor: www.vision-doctor.co.uk/optic-quality/limiting-resolution-and-mtf.html
- CCD Spatial Resolution - Understanding spatial resolution (Andor learning academy): www.andor.com/learning-academy/ccd-spatial-resolution-understanding-spatial-resolution
- Understanding image sharpness (Tutorials by Norman Koren)
- Part 1: Introduction to resolution and MTF curves: www.normankoren.com/Tutorials/MTF.html
- Part 1A: Resolution and MTF curves in film and lenses: www.normankoren.com/Tutorials/MTF1A.html
- Part 2: Resolution and MTF curves in scanners and sharpening: www.normankoren.com/Tutorials/MTF2.html
- Part 5: Lens testing: www.normankoren.com/Tutorials/MTF5.html
- Part 6: Depth of field and diffraction: www.normankoren.com/Tutorials/MTF6.html
- Digital cameras vs. film, part 1: www.normankoren.com/Tutorials/MTF7.html
- Digital cameras vs. film, part 2 : www.normankoren.com/Tutorials/MTF7A.html
- Sharpness: What is it and how is it measured? (Imatest): www.imatest.com/docs/sharpness/
|
made by |
| 23.04.2018 |